
Renting vs Buying in Australia 2026
- Vansh Mittal
- 3 days ago
- 6 min read

Analyst : Vansh Mittal
Editor : Vansh Mittal
Published : 18th May 2026
The Lion Brief
The Honest Financial Comparison
A city-by-city analysis of whether buying or renting is financially superior across Sydney, Melbourne, Brisbane, Perth, and Adelaide — at current property prices, mortgage rates, and rental conditions.
The Questions Every Australian is Asking
For the first time in a generation, renting is not simply a stepping stone to homeownership in Australia — it is, in several major cities, the financially rational choice. Across Sydney, Melbourne, Brisbane, Perth, and Adelaide, the calculus of rent versus buy has been fundamentally reshaped by three simultaneous forces: property prices that have outrun wages for two decades, an RBA cash rate that has risen 75 basis points in 2026 alone to reach 4.35%, and rental markets that, while tight, offer costs far below the true cost of ownership in most capitals.
This report cuts through the noise. Using current median property prices, variable mortgage rates, weekly rental data, and a full-cost-of-ownership model that accounts for stamp duty, maintenance, insurance, and opportunity cost, The Lion Brief presents an honest, city-by-city verdict on the rent vs. buy question in 2026.
The answer is not the same in every city — and that is precisely the point.

"Only 14% of median-income households nationally can afford the median-priced home in 2026 — down from 43% just three years ago." — PropTrack Housing Affordability Report 2026
How We Calculate the True Cost of each option
A simple comparison of weekly rent versus monthly mortgage repayment misses most of the financial picture. This report models the full annual cost of each option on the following basis:
Buying costs included:
• Mortgage repayments: principal and interest, 30-year term, 80% LVR at 6.84% variable rate
• Stamp duty: using current owner-occupier rates for each state
• Council rates: approximately $2,000 per year
• Building insurance: approximately $2,500 per year
• Maintenance provision: 1% of property value per year (standard financial planning rule)
• Opportunity cost of deposit: foregone return on deposit sum invested in a diversified ASX index fund at 7% annual return net of tax
Renting costs included:
• Weekly rent × 52
• Contents insurance: approximately $600 per year
• Deposit equivalent assumed to remain invested and growing at 7% net per annum
All figures use current median house prices and median weekly rents per city, with a 20% deposit assumption. Break-even analysis assumes 7% annual capital appreciation on property — the long-run historical average for Australian residential property.
The numbers side by side
The table below presents the core model inputs and outputs for each of the five major capital cities. Annual ownership cost includes mortgage, rates, insurance, maintenance, and opportunity cost of deposit.


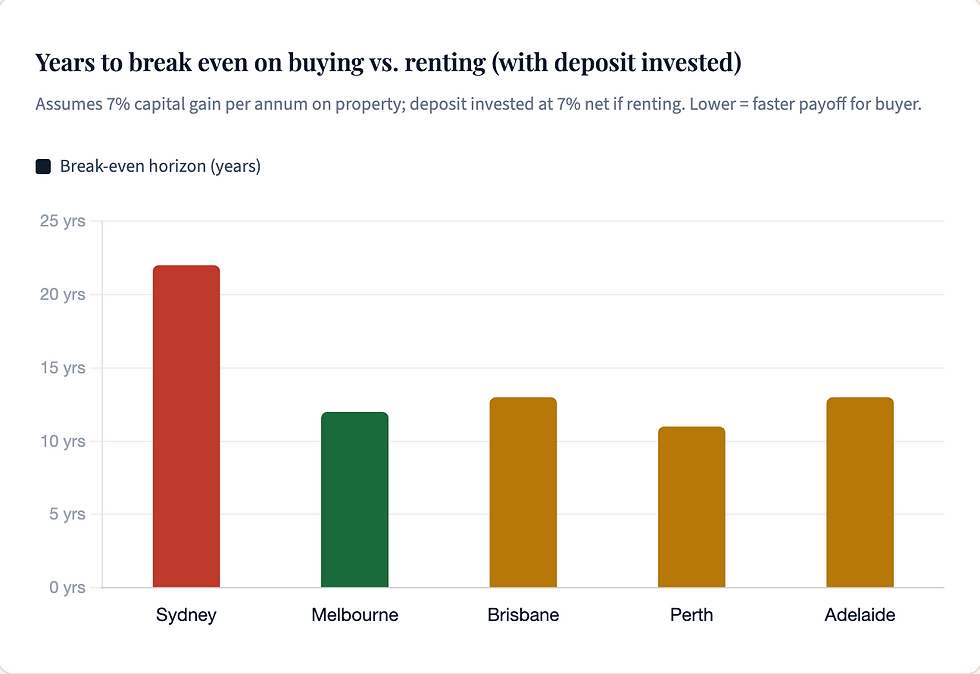
Break Even Analysis : How long does buying take to pay off?
The break-even table below shows how many years a buyer needs to hold the property — at the assumed 7% annual capital growth rate — before buying becomes financially superior to renting and investing the difference. It also shows the minimum annual price growth needed to simply break even against the renter's investment portfolio.
City | Break-Even (yrs) | Min. Growth to Break Even | Risk Assessment |
Sydney | 22 years | 6.3% p.a. needed | Very High Risk |
Melbourne | 12 years | 7.0% p.a. needed | Manageable |
Brisbane | 13 years | 7.0% p.a. needed | Borderline |
Perth | 11 years | 6.8% p.a. needed | Borderline |
Adelaide | 13 years | 7.1% p.a. needed | Borderline |
Assumes: 7% annual capital growth (Australian long-run average); 7% net investment return on renter's deposit equivalent; full cost-of-ownership model as described in methodology. Break-even period is where cumulative wealth of buyer equals cumulative wealth of renter.
A City-by-City Deep Dive
Sydney - The Case for Renting Has Never Been Stronger
Sydney is in a category of its own. With a median house price of approximately $1.75 million and a trajectory toward $2 million by end-2026, the carrying cost of ownership is extraordinary. A buyer putting down a 20% deposit of $350,200 and servicing a $1.4 million mortgage at 6.84% faces monthly repayments of approximately $9,280 — or $111,360 per year in mortgage alone. Add council rates, insurance, maintenance (approximately $17,500 per year on a $1.75M property), and the opportunity cost of the $350,200 deposit (approximately $24,514 per year foregone at 7%), and the true annual cost of owning the median Sydney house exceeds $152,000.
The median Sydney house rents for approximately $800 per week, or $41,600 per year. That gap — $110,400 annually — represents the true cost premium of ownership over renting in Sydney in 2026. Even accounting for potential capital gains, a Sydney buyer requires sustained price appreciation of approximately 6.3% per year simply to break even with a renter who invests the difference.
Melbourne - Renting Wins, but the Margin is Improving for Buyers
Melbourne's property market has significantly underperformed its peers. While Brisbane, Perth, and Adelaide surged 14–26% in the past year, Melbourne recorded flat to slightly negative monthly movement in early 2026. The median house price sits at approximately $938,000 — meaningfully below Brisbane and Perth, and less than half of Sydney's median.
Yet even at $938,000, the maths still favour renting. Monthly mortgage repayments on a $750,400 loan at 6.84% are approximately $4,970, or $59,640 annually. With council rates, insurance, and maintenance on a $938,000 property (approximately $11,880 per year), plus opportunity cost of the $187,600 deposit ($13,132 per year), the total annual ownership cost reaches approximately $84,200. Melbourne's median house rent, at approximately $590 per week, costs $30,680 annually — a gap of $53,500 per year in favour of renting.
Brisbane - The Olympic Premiums bakes in long-term Tailwinds
Brisbane's median house price crossed $1 million and has delivered 19.9% annual growth, making it Australia's second-most expensive capital. The annual cost gap between buying and renting is approximately $55,500. Brisbane's rental yield environment is comparatively attractive, and the 2032 Olympics provides a credible long-term demand catalyst. However, with an 84% trough-to-peak gain over five years, Brisbane's affordability advantage over Sydney and Melbourne has largely evaporated.
Perth - High Rents narrow the Gap, but Prices have Run Hard
Perth is the most unusual market in this analysis. Rental vacancy rates are extremely low, and house rents in the mid-$700s per week are the second highest of any capital. This narrows the rent vs. buy gap to approximately $50,500 annually — the lowest of any capital in our model. Perth has also delivered 26% annual price growth. Yet the 'Perth discount' that drove those extraordinary gains is disappearing, with the median house price crossing $1 million.
Adelaide - Underrated Rent Value in a Rising Market
Adelaide has delivered 14.3% annual house price growth, taking the median to approximately $980,000. Despite the price appreciation, Adelaide's median weekly house rent of approximately $620 per week remains the second cheapest of the capitals. The annual cost gap between buying and renting is approximately $53,500 — and buyers entering at current prices are paying for growth that has already occurred.
The Key Variables that Shift the Verdict
Rate Cuts : Markets are currently pricing the first RBA rate cut no earlier than mid-2027. If inflation surprises to the downside and the RBA moves earlier — or cuts faster — mortgage repayments would fall materially and the buying case would strengthen across all cities. A return to a 5% variable rate, for example, would reduce monthly repayments on an $800,000 loan by approximately $890.
Holding Period : The break-even analysis assumes a 7% annual capital gain. On a 5-year horizon, renting wins in every city in our model. On a 15-year horizon, the calculus shifts materially — particularly in Melbourne and Adelaide, where entry prices are lower and price-to-income ratios are less extreme. Buyers who can genuinely commit to a 10+ year holding period substantially improve their financial case.
Rent Vesting : Increasingly, financially sophisticated Australians are rent vesting — renting where they want to live and buying investment property in more affordable markets. This approach captures the lifestyle flexibility of renting in expensive inner-city locations while gaining leveraged exposure to property markets with better yield dynamics.
Case for Buying in 2026 | Case for Renting in 2026 |
Forced savings through mortgage payments | Annual cost gap of $50k - $100k vs buying a property |
Leverages exposure to capital gains | Deposit invested in index funds grows at competitive rates |
Long-term certainty - no lease renewals or rent increase | Flexibility to relocate |
Tax Advantages (negative gearing for investment) | No exposure to maintenance costs or council rates |
Principal repayment build equity over time | Rents have stabilised in most capitals |
Melbourne and Adelaide offer lower entry points | Only 14% of Australians can afford median home nationally |
Rate cuts expected mid-2027 | Further rates hikes possible - serviceability risk remains |
Demand won't disappear | No stamp duty outlay (saves $40k - $80k upfront) |
Disclaimer: This report is produced for educational and informational purposes only. Nothing contained herein constitutes financial, legal, or investment advice. All statistics and illustrative figures are sourced from publicly available research or are modelled estimates — actual outcomes will vary. Readers should seek advice from a licensed financial adviser before making any financial decisions. The Lion Brief is not a licensed financial adviser.
© 2026 The Lion Brief. All rights reserved.


Comments